


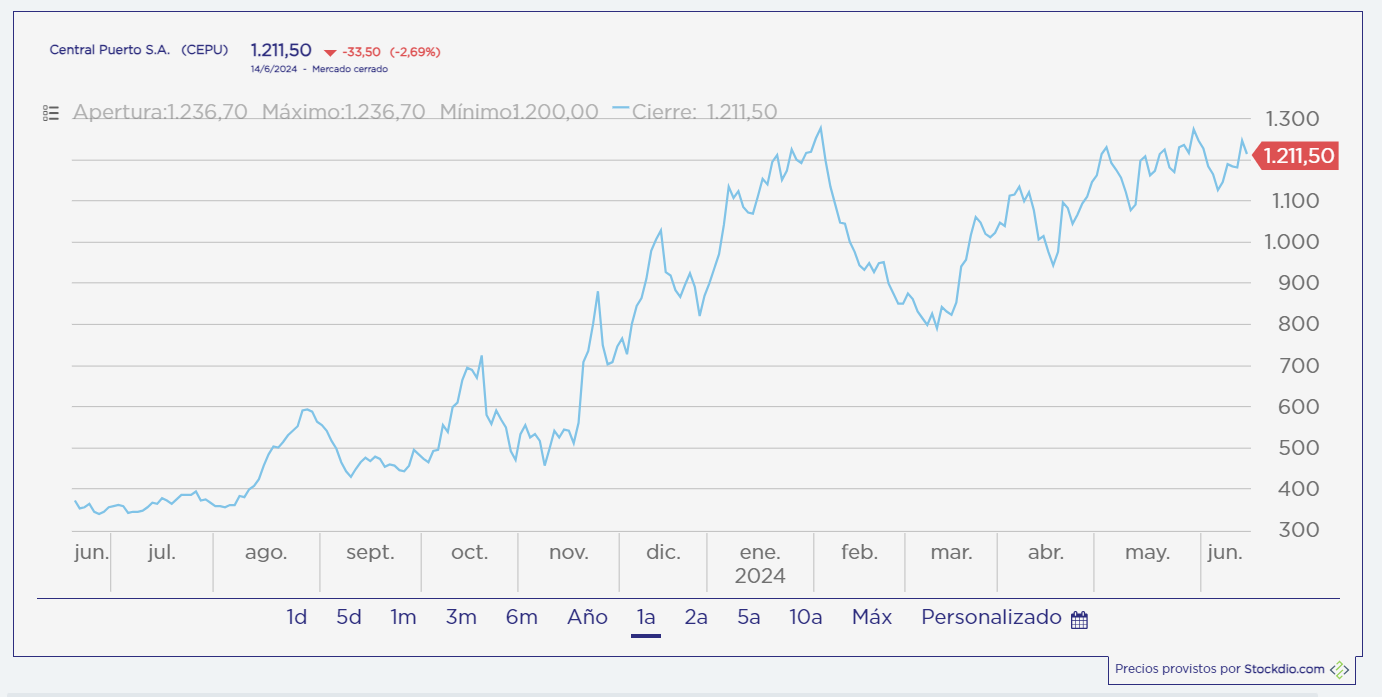
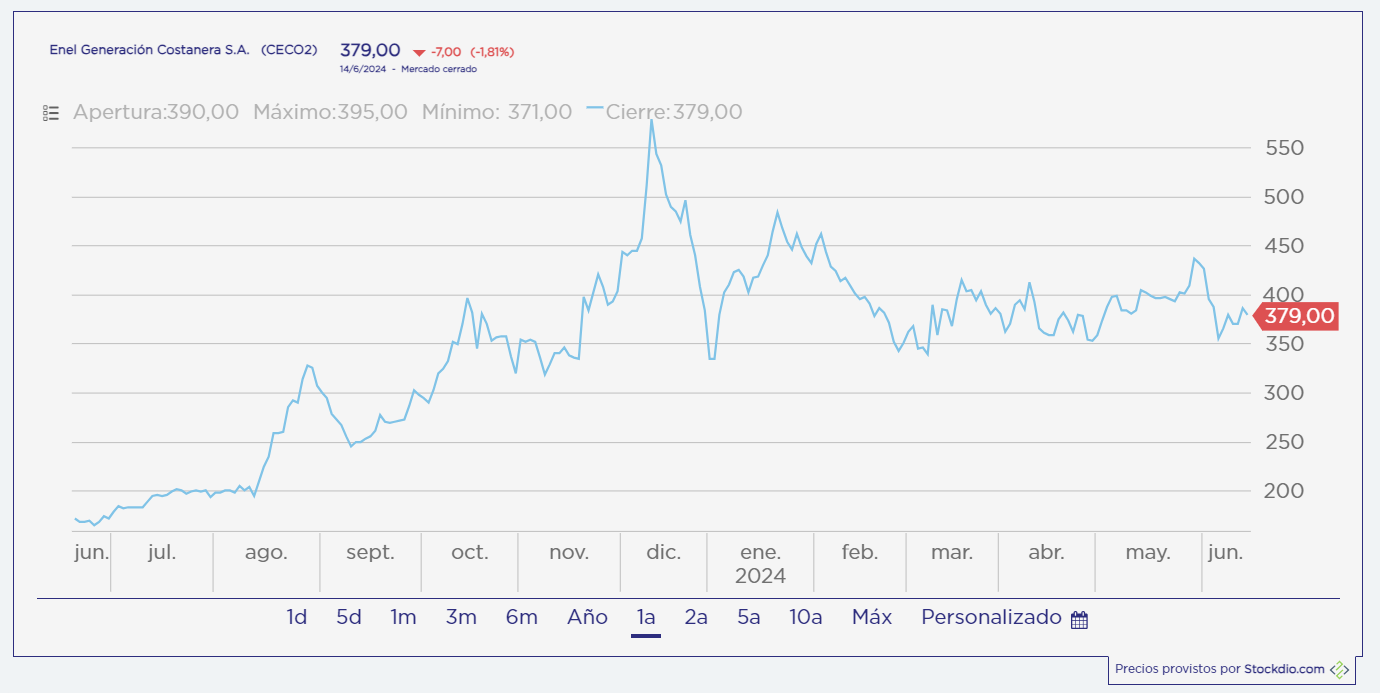
The CEPU, CEPU.BA and CECO2.BA share price chart shows how they have evolved in the different markets where they operate, offering a dynamic perspective of their performance over time
Previous close:
$8.925 ‹
0.17 (1.92%)
CEPU | New York Stock Exchange
CEPU
9.78
USD
NEW YORK STOCK EXCHANGE (NYSE) April 7, 2026 EST
MARKET CAP
947.65
USD
NEW YORK STOCK EXCHANGE (NYSE) April 7, 2026 EST
Previous close:
$8.925 ‹
0.17 (1.92%)
CEPU.BA | BYMA
CEPU.BA
9.78
ARS
Bolsas y Mercados Argentinos (BYMA) April 7, 2026 GTM-3
MARKET CAP
947.65
ARS
Bolsas y Mercados Argentinos (BYMA) April 7, 2026 GTM-3
Previous close:
$8.925 ‹
0.17 (1.92%)
CECO | BYMA
CEPU
9.78
ARS
Bolsas y Mercados Argentinos (BYMA) April 7, 2026 GTM-3
MARKET CAP
947.65
ARS
Bolsas y Mercados Argentinos (BYMA) April 7, 2026 GTM-3
Previous close: $8.925 < 0.17 (1.92%) CEPU Nyse | New York Stock Exchange
CEPU
9.78
USD
NEW YORK STOCK EXCHANGE (NYSE) July 16, 2024 EST
MARKET CAP
947.65
USD
NEW YORK STOCK EXCHANGE (NYSE) July 16, 2024 EST